![[bracket]](https://substackcdn.com/image/fetch/$s_!YRIN!,w_80,h_80,c_fill,f_webp,q_auto:good,fl_progressive:steep,g_auto/https%3A%2F%2Fbucketeer-e05bbc84-baa3-437e-9518-adb32be77984.s3.amazonaws.com%2Fpublic%2Fimages%2F7982c3aa-3a4d-41d9-8681-2abd1ecd6d6c_529x529.png)
US swing voters and how to swing them
An original data-driven analysis of how swing voters think

Swing voters are near-mythical beasts when it comes to elections. Everyone wants to speak directly to them, everyone thinks they know who are swing voters are, and everyone thinks they’re going to turn them out. As it turns out, though, it’s really not that easy. It can be instructive to try and analyse who they are, what they might look like, and how they might think.
The problem, of course, starts from definition itself. Here’s my definition of a swing voter:
Take a US voter this November. They have not two, but three main choices. They can vote for Trump, vote for Biden, or stay home/vote third party. A swing voter, to me, is someone open to being convinced by more than one of these three options. If we want to define a swing voter, then, there are three** types of swing voters:
Group 1, Trump/Biden: Voters who are undecided between the two major candidates,
Group 2, Trump/Home: Voters who are undecided between voting for Trump or staying home/voting third party, and
Group 3, Biden/Home: Voters who are undecided between voting for Biden or staying home/voting third party.
**Of course, there might be people who are completely undecided - who may or may not vote and, if they do, may vote for either of the two candidates. But I assume them to be a very small percentage - even Independents have been shown to consistently track one way or the other.
Only group 1 is generally assumed to be swing voters in the widespread definition, but as we will see, the other two groups can be equally important.
Things are muddy to begin with, because our memories are terrible. People report that they voted when they didn’t[1], or remember their past votes to be more in line with their present votes than they were[2], or are more likely to remember themselves as voting for the winner[3]. This effect is measured to be somewhere between 10 and 25 per cent[4]of recalled votes. This creates a limit to how much we can actually gauge from what people said they did in past elections. And of course, when elections are won by about 78,000 votes in four states[5], our instruments are simply too blunt for direct attribution. But we can definitely look at what factors are in play here.
With this in mind, let’s try to answer two questions: Who are the swing voters? And what makes them swing?
Who are these swing voters?
The American National Election Studies (ANES), a collaboration between Stanford and the University of Michigan, has been gauging voter behaviour consistently since 1948. In particular, they ask respondents to express their feelings about a particular candidate or party on a ‘Feelings Thermometer’. Essentially, a voter is asked to give a number expressing their feelings about, say, Donald Trump, on a scale of 0–100, 100 being very warm and 0 being very cold. The voter is asked the same thing about Joe Biden. The ANES also asks post-election responses, so we can track voters’ self-reported votes as well.
In an article in 2007, William Mayer suggested a way to identify swing voters (Group 1 in the definition above)[6] - using ANES data - that has since been widely used. In fact, we can use ANES’ cumulative data file (1948–2016)[7] to look at his findings and extend his analysis till 2016. (Filtering for respondents who have answered the feelings thermometer for Republicans and Democrats gives me about 31 thousand responses over the years).
Note: the below insight is Mayer’s, but I’ve added some visualisation and reasoning. Check Footnote 6 for Mayer’s original analysis.
First, we create a metric to judge how a respondent compares the two candidates. For this, we can subtract the thermometer rating for the Democrat from that of the Republican (so, a rating of +100 indicates a respondent heavily favouring the Republican, and a rating of -100 indicates a respondent heavily favouring the Democrat). Here’s what the distribution of the ratings difference looks like:
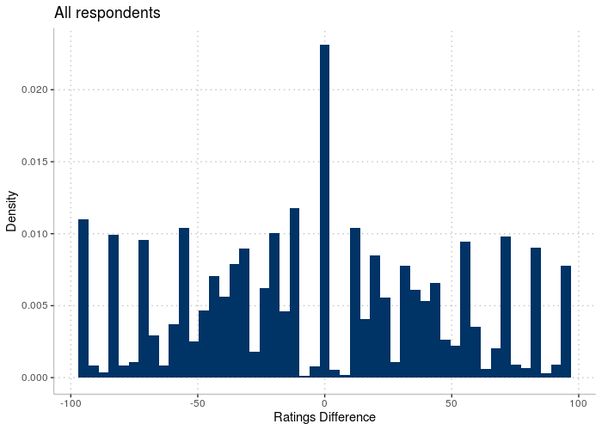
There is a visible peak at 0 (i.e. the respondent rates the two candidates equally) and a distribution of partisans on either side.
These, of course, are the responses in the pre-election survey. The ANES will conduct post-election surveys as well, and ask respondents their actual voting status (whether they voted or not, and if they did, whom they voted for). That gives us a chance to look at which way voters end up.
First, let’s look at who ended up not voting (Biden/Home and Trump/Home voters who make the Home choice):
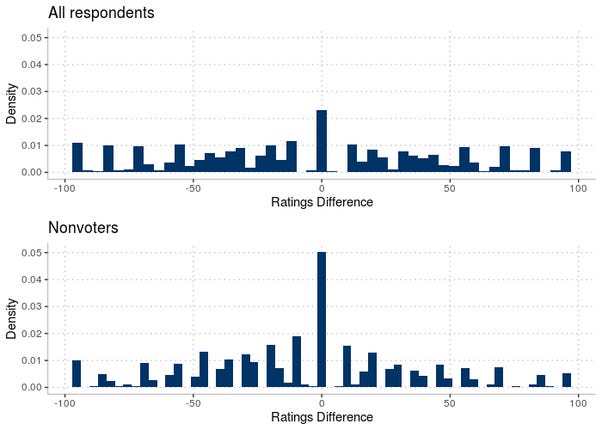
There are no real surprises here: the bulk of people who end up not voting in an election tend to have fairly similar feelings about both major candidates. Those with strong feelings, one way or another, generally end up voting.
There’s an interesting pattern with people who vote:
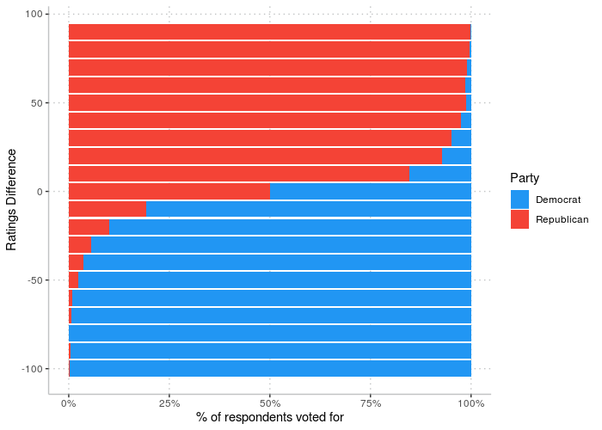
Note: The number on the Y axis is the lower bound, i.e. the first bar indicates a ratings difference of -100 to -90, the second -90 to -80, and so forth.
Highly Democratic or highly Republican partisans aren’t really voting for the other party - but that shouldn’t really be surprising. And the obvious correlation between the thermometer rating and voting likelihood is, as Mayer says, more reassuring than illuminating. The key insight is this: there really isn’t a whole lot of persuasion going on. If a voter rates one of the candidates better than the other by more than 15 points, they are more than 90 per cent likely to vote for that candidate.
Mayer recommends this 15-point threshold as a cutoff for swing voters: voters who have a ratings difference between the two major candidates which is between -15 and +15 can potentially be swayed to the other side. (he puts the defection rate at about 23 per cent.)
In 2016, to take a quick example:
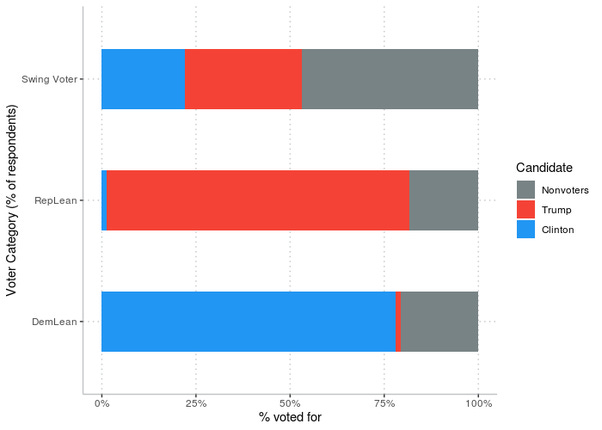
Democratic Leaners who voted - people who rated Clinton more than 15 points higher than Trump - went overwhelmingly for Clinton, about 98%. Republican leaners, when they did, voted overwhelmingly for Trump, again about 98%. Only about half of swing voters surveyed voted - but those who did broke 60–40 for Trump.
Swing voters are a diverse group, and not that demographically different from the electorate at large.[8] From the 1962–2004 elections in the ANES data, Mayer has also shown that none of the groups traditionally talked about as swing voters - women, the young, the elderly, Catholics - were actually over-represented in the swing voting population. For the sake of relative brevity (hey, congratulations to the twenty people who made it to the end of my piece on climate change), I won’t repeat these points about demographic identity.
What we can do, with this defined base of swing voters, is try to understand their political identity a little bit using data.
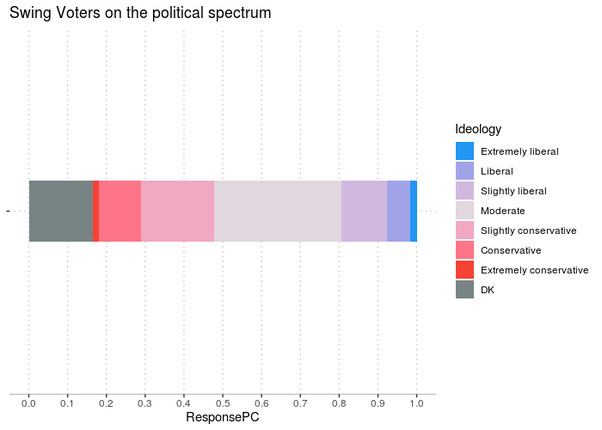
Swing voters tend to be moderate to slightly conservative, or not have a label for their political identity.
2. Contrary to the image of the low-information swing voter, swing voters say they follow public affairs about the same as the overall population.
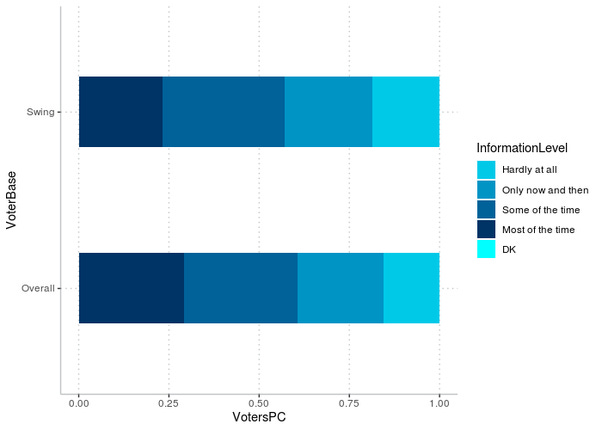
Answers to the question “Would you say you follow what's going on in government and public affairs most of the time, some of the time, only now and then, or hardly at all?”
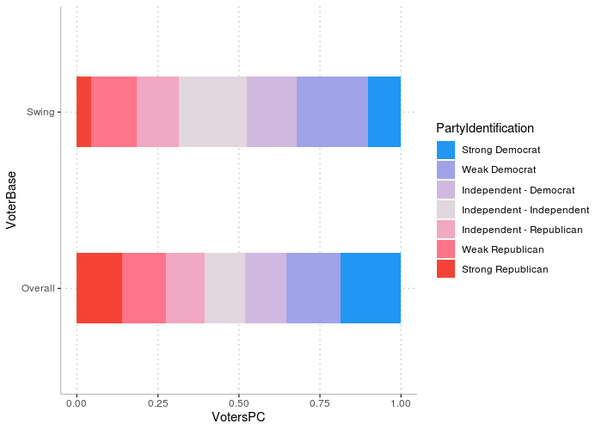
3. More along expected lines, they have less of a partisan identity than the general population.
4. Swing voters are less likely to see a difference between what the two major parties stand for, by about 9 percentage points.
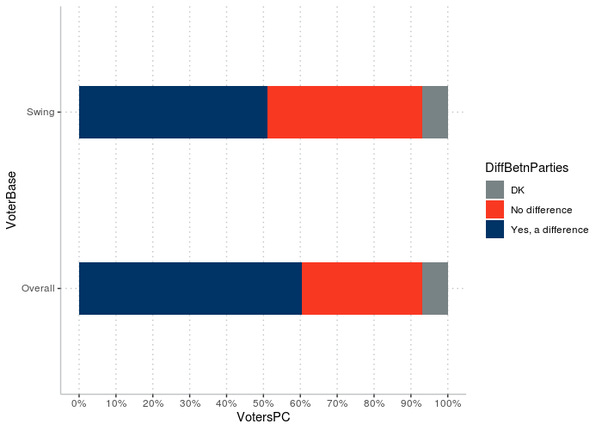
Question: Do you think there are any important differences in what the Republicans and Democrats stand for?
5. People are generally not likely to have attended a political meeting or rally, but swing voters are even less likely:
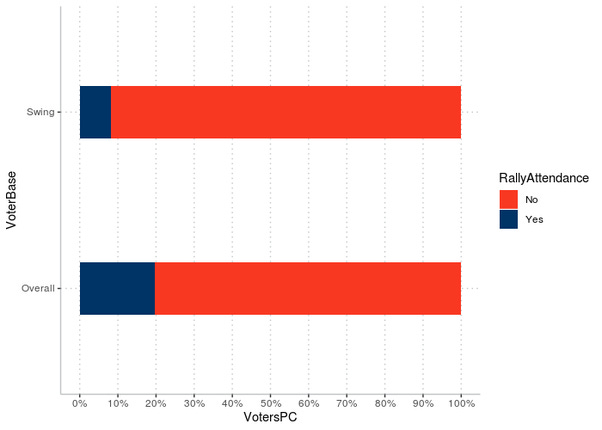
Question: Did you go to any political meetings, rallies, (1984 AND LATER: speeches,) (1978,1980,1982: fund raising) dinners, or things like that(1984 AND LATER: in support of a particular candidate)?
6. Swing voters are more likely to have not discussed politics with family or friends in the last week:
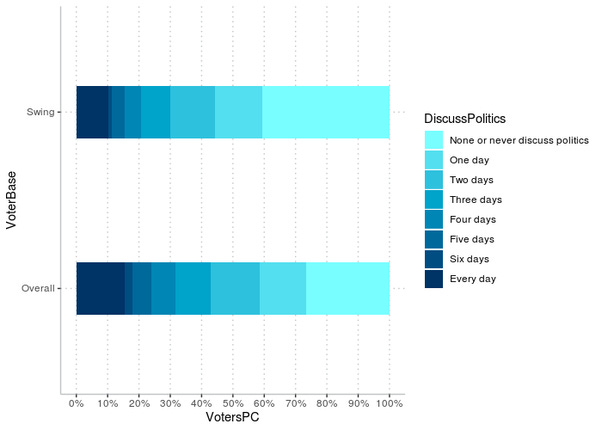
Question: How many days in the past week did you talk about politics with your family or friend?
More than 40 per cent of swing voters report not discussing politics in the last week, compared to about 26 per cent overall.
That’s a swing voter for you: someone who doesn’t have enough of a partisan identity or a label for their politics, who doesn’t see enough of a difference between the parties on positions, and is less likely to be politically involved or even discuss politics - though they look about the same as everyone else otherwise.
It has to be noted that, as the US electorate has grown polarised, the subset of voters who reliably vote, and are actually open to vote for different candidates each election, has actually gone down[9].
2. What makes them swing?
Now then, let’s say you’re Biden’s campaign manager going into November. In order to win, what you need to do is: Get enough of Trump/Biden voters to vote for you instead of Trump, get enough Biden/Home voters to turn out instead of staying home or voting third party, and hope enough Trump/Home voters stay home to push you over the edge.
The problem, of course, is that these objectives can be contradictory. The incentive for parties to tack towards the centre is that it is likely to convince the moderate Trump/Biden voters to turn out for them instead of their opponent. But this incentive might be overstated: In 2016, for example, about 9 per cent of Obama voters went and voted for Trump; but another 7 per cent stayed home, and an estimated 3 per cent voted third party[10]. In an era of increased polarisation, the argument goes, this is an ever-shrinking slice of the pie, and you may be better off trying to energise Biden/Home voters to turn out.
Well, not so fast. The problem is that, in a polarised electorate, there is a strong motivation to voters of both parties simply to deny the other party the control of the government. And this motivator for Trump/Home voters is the strongest if the Democratic nominee is perceived to be an “extremist”[11]- easiest to do if the nominee tacks too much to the left to try and excite the base.
Actually predicting which way a swing voter will end up, whether they will end up voting and whom they will end up voting for is by nature difficult, volatile, and affected by a bunch of different factors specific to an election. I won’t attempt that here. What I can do is simply demonstrate the first point above a little.
The ANES, as we saw above, asks respondents for their own ideology on a scale of 1 to 7, from Extremely Liberal to Extremely Conservative. It also asks for their rating of each parties’ ideology on the same scale.
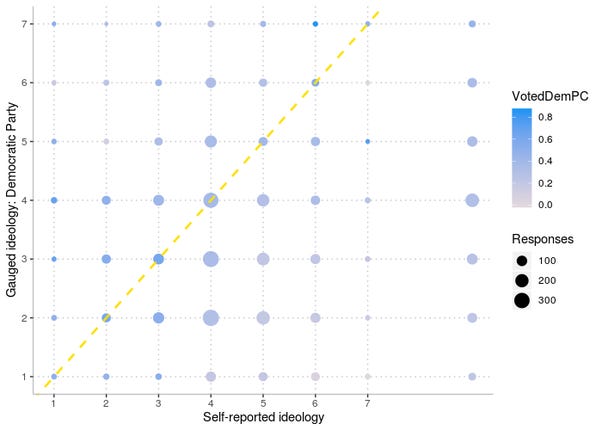
Let’s look at the way swing voters view themselves with respect to both parties:
Democrats
Republicans
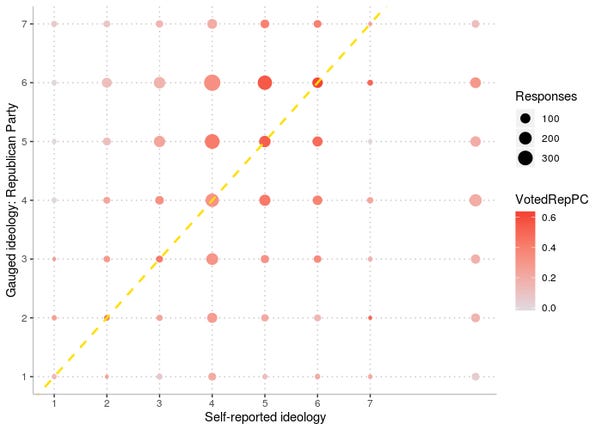
A short primer on reading these graphs: X axis is respondent’s ideology, self-reported. Y axis is respondent’s view of the Democratic or Republican Party’s ideology. The size of the dot is the number of swing voter respondents who fall on that particular intersection; its colour indicates the proportion of those that ends up voting for that particular party.
In both cases, even if they’re swing voters, they’re much more likely to vote for a party when they see it as ideologically close to themselves. Swing voters are definitely still moderates, and they are unlikely to vote for what they may perceive as ideological extremists.
As of September 2019, according to a poll by the Kaiser Family Foundation[12], the proportion of Trump/Biden swing voters stood at 8%. Another 13% of voters said they would probably vote for the Democratic nominee, and 9% said they would probably vote for Trump. Of course, these numbers are going to be in constant flux with new events and as the Democrats coalesce behind their nominee, but it’s a helpful snapshot in time.
Thanks for asking a fun question!

If you liked this, share this with a friend!
If you’re the friend this was shared with, subscribe below so that you can know more about not only normal voters, but swing voters, and some seam/spin voters too! (cricket pun. Apologies.)
To avoid this email getting clipped in your inbox, I haven’t included the sourcing links. To check out sources, please see the original answer on Quora!